
Merging Three Data Exploration Tools into One

My Role
UX Designer
UX Researcher
Team
Brett Wakefield - Design Manager
Lauren Low - UX Designer
Ori Nevares - UX Designer
Mirko Link - Product Manager
Ian Booth - Product Manager
Skills
UX/UI Design
Responsive Prototyping
Workshop Facilitation
Cross team collaboration
Results
• Combined 3 data exploration tools into 1 e2e experience.
• Enhanced user experience by providing consistent and enhanced data exploration experience across platform.
• Supported SAP wide business goal of becoming more cloud native
Timeline
April 2020 - Aug 2020 (4 mos)
Preview
Merging three separate data exploration tools into one seamless experience.
1
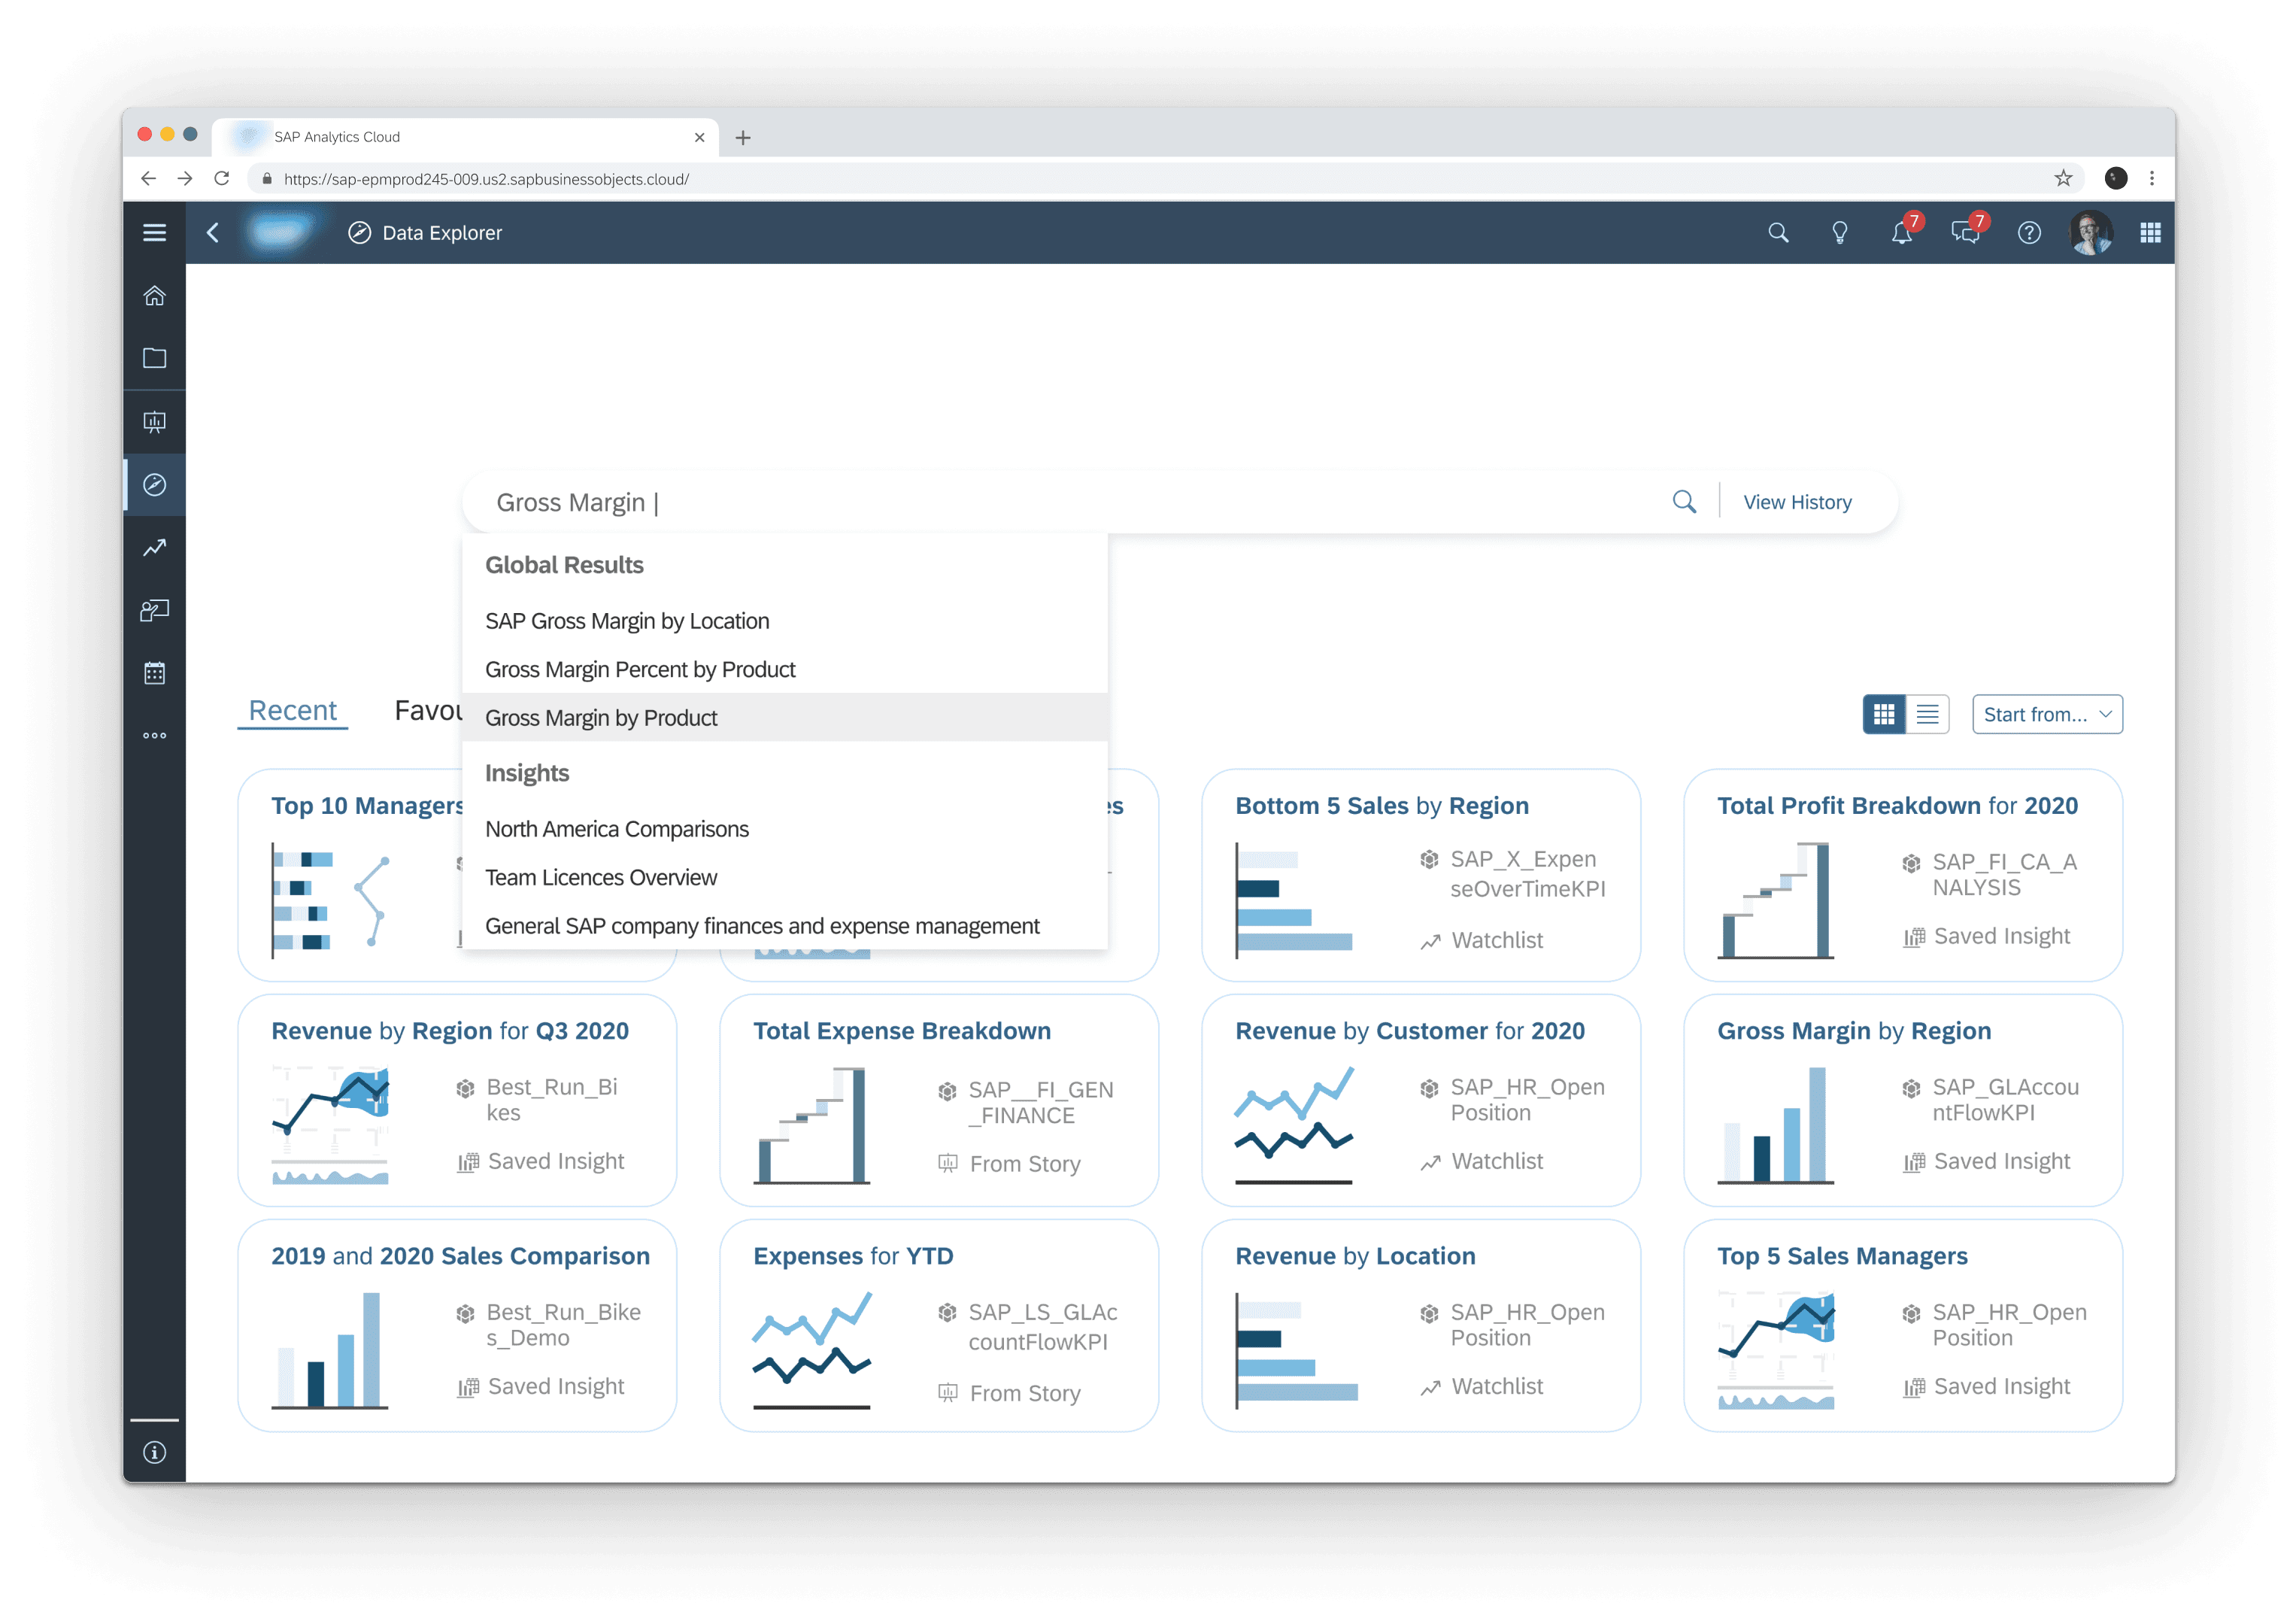
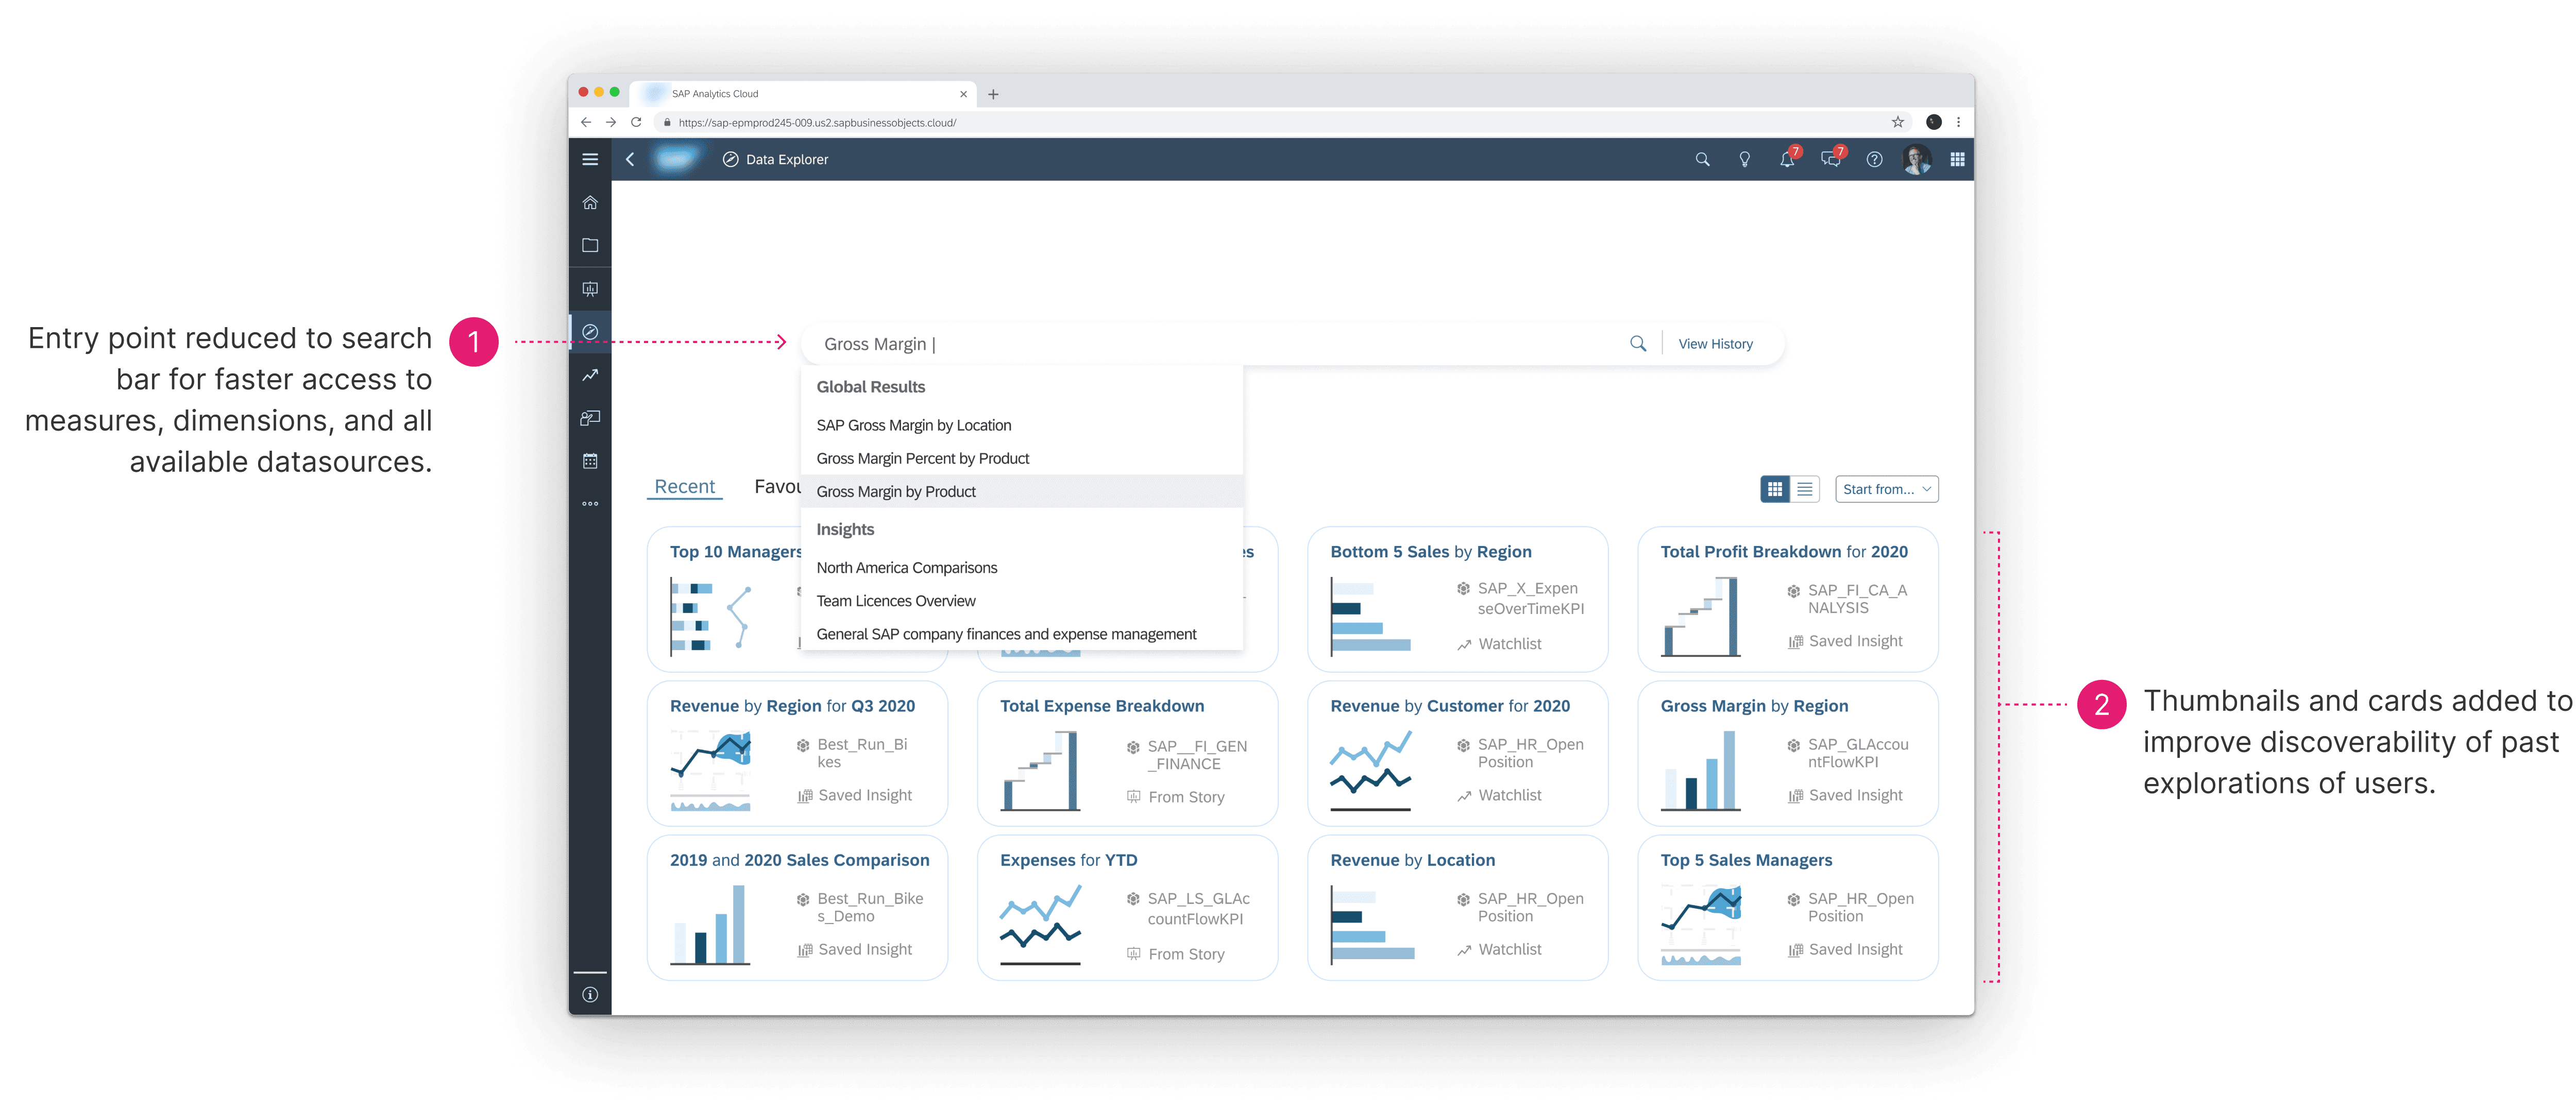
Natural Language Processing
Leveraging NLP to create a low barrier entry for users of all expertise.
2
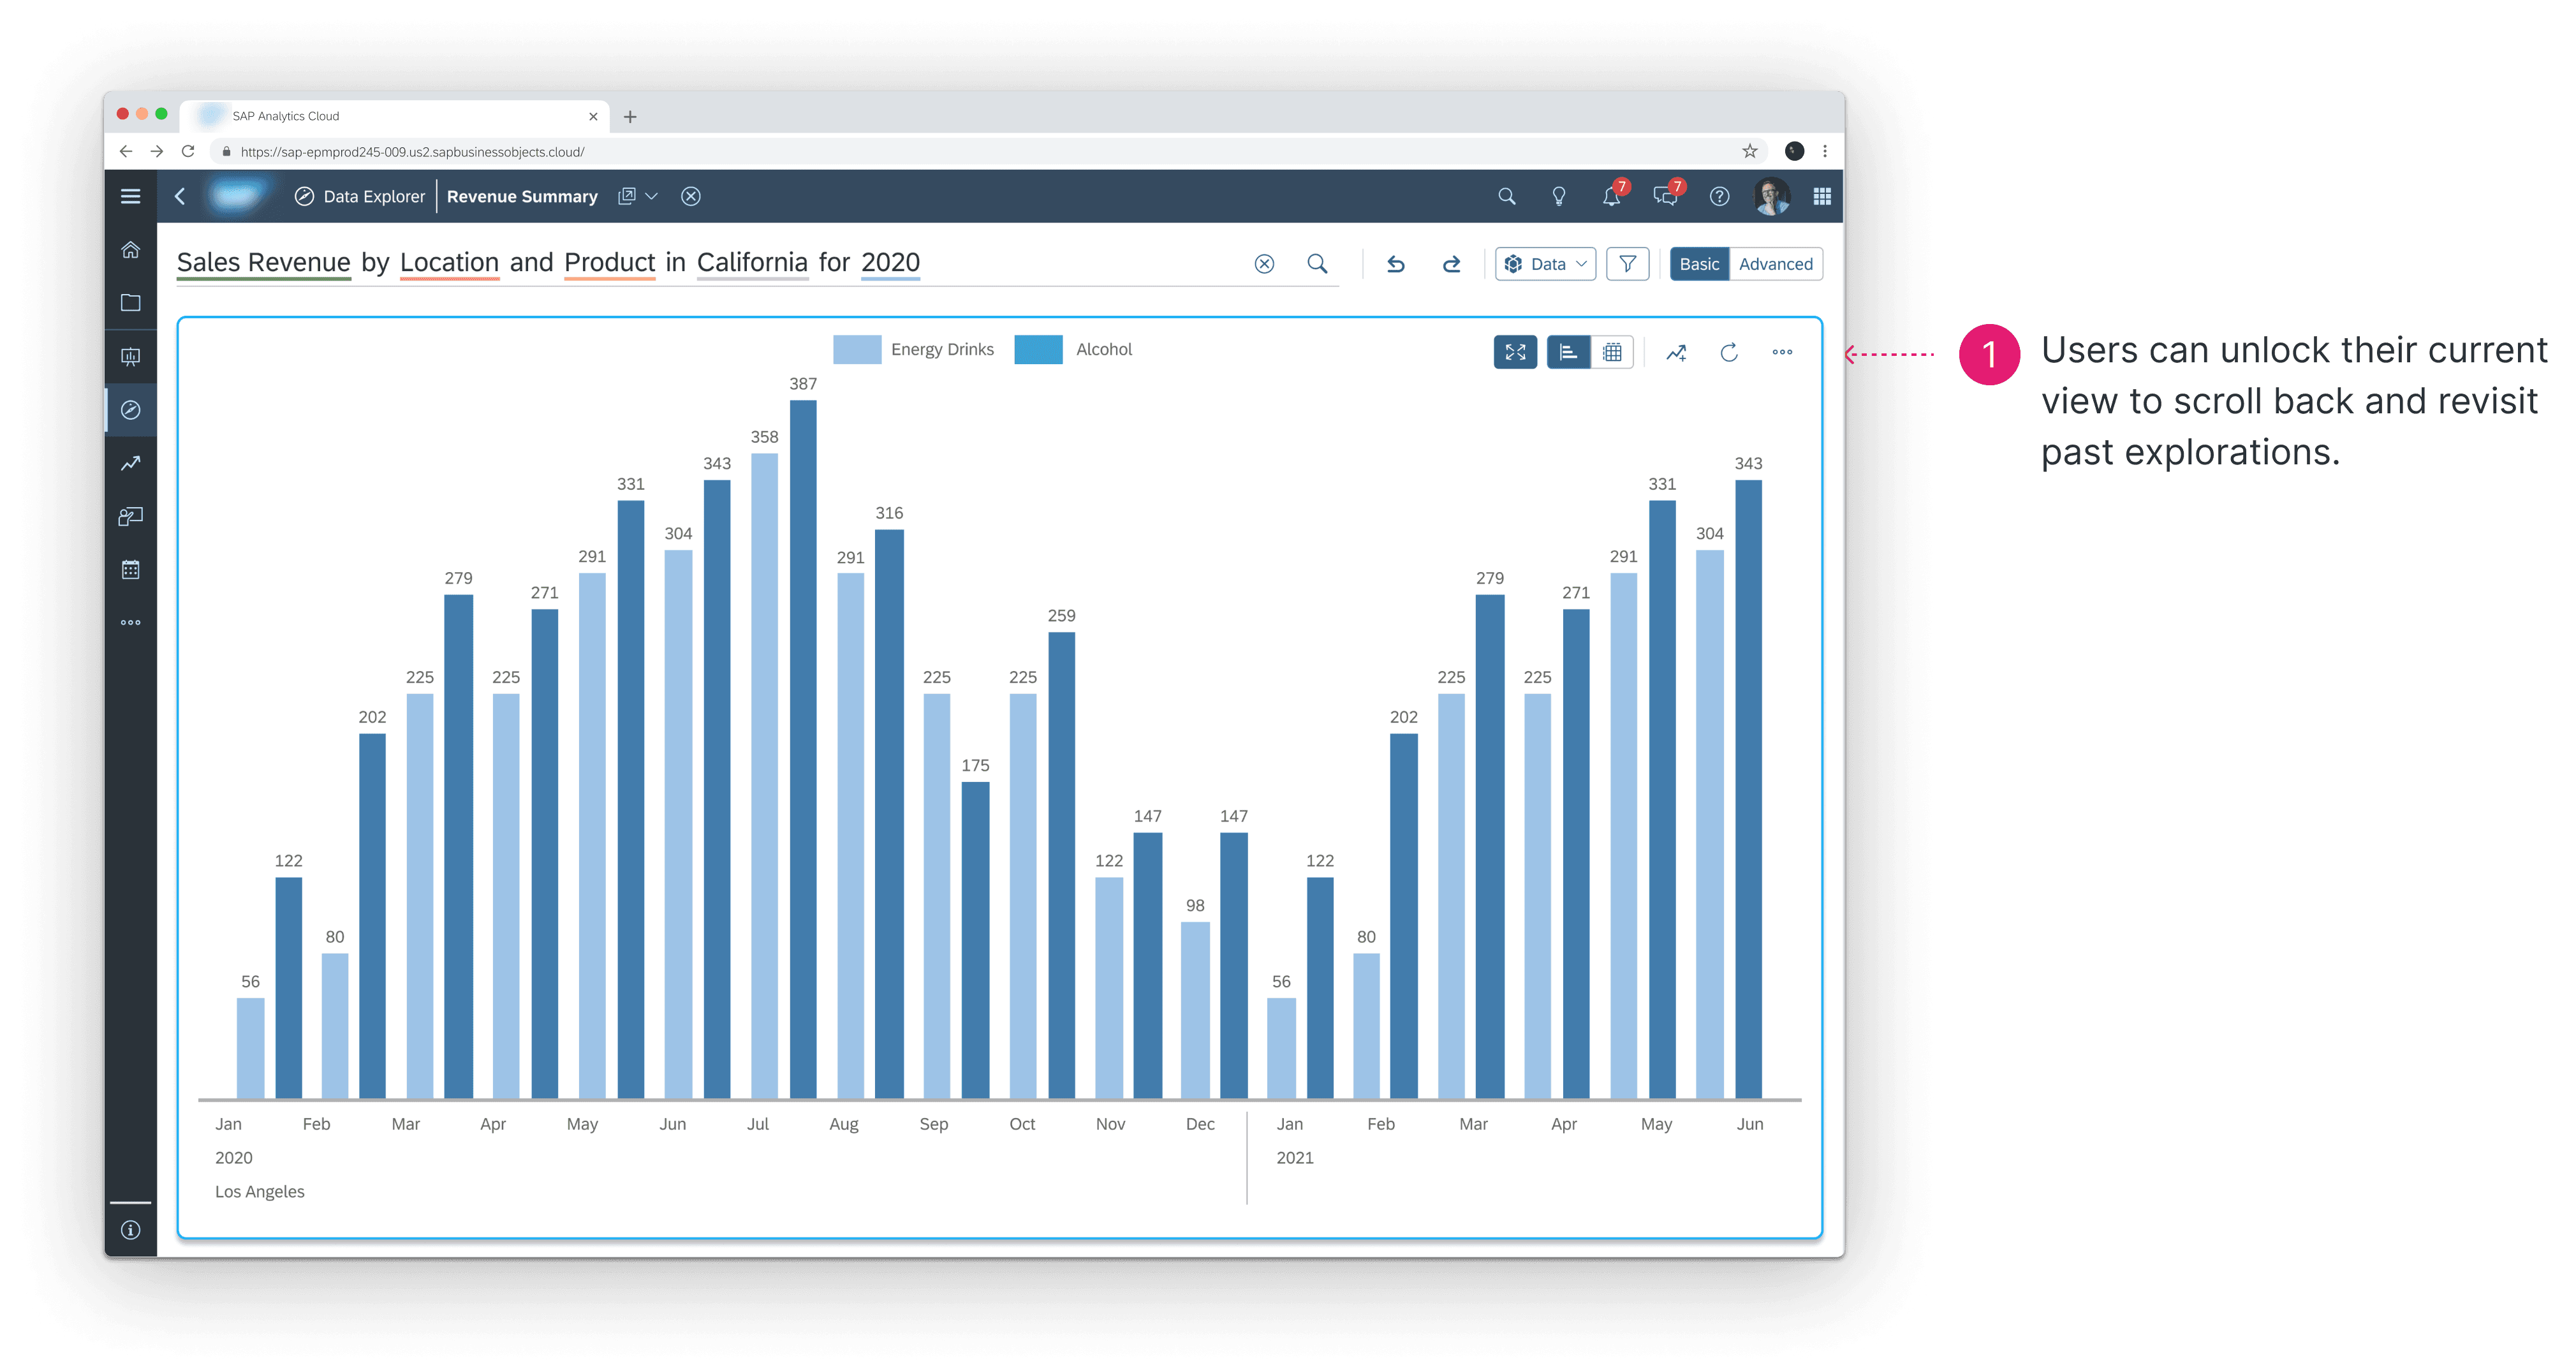
Exploration History
Ability to scroll back through your history of explorations to view your searches.

3
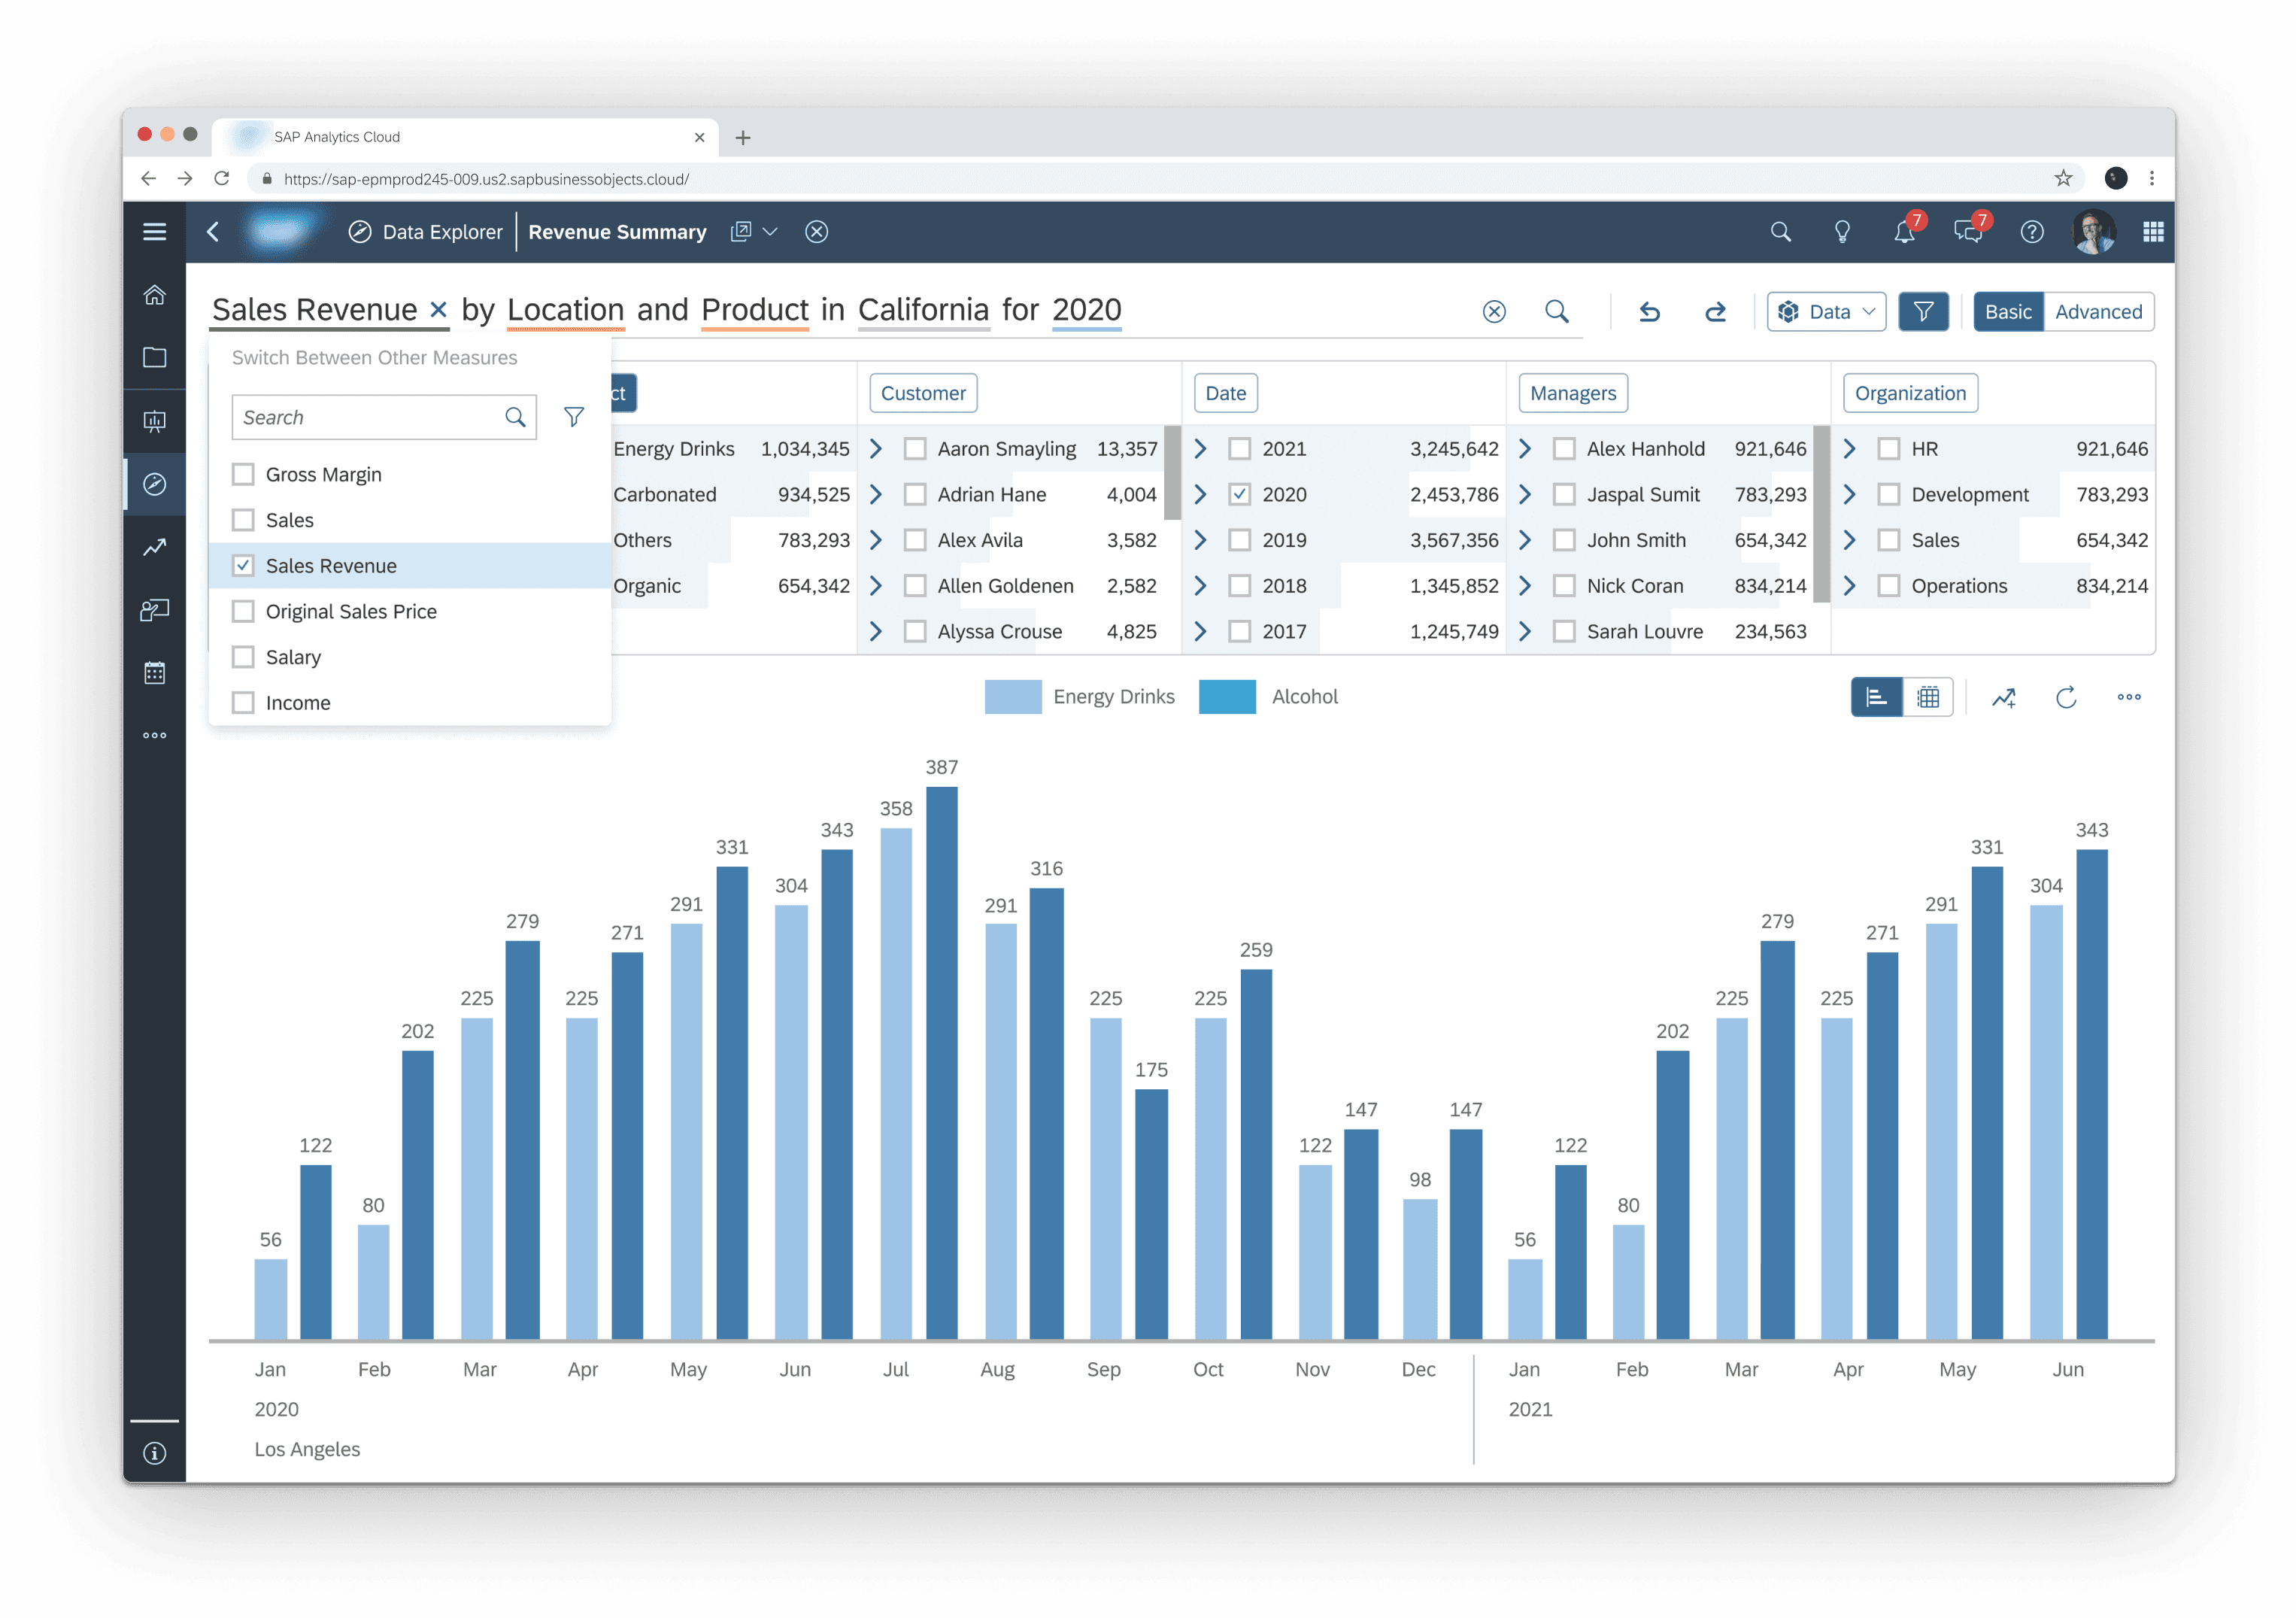
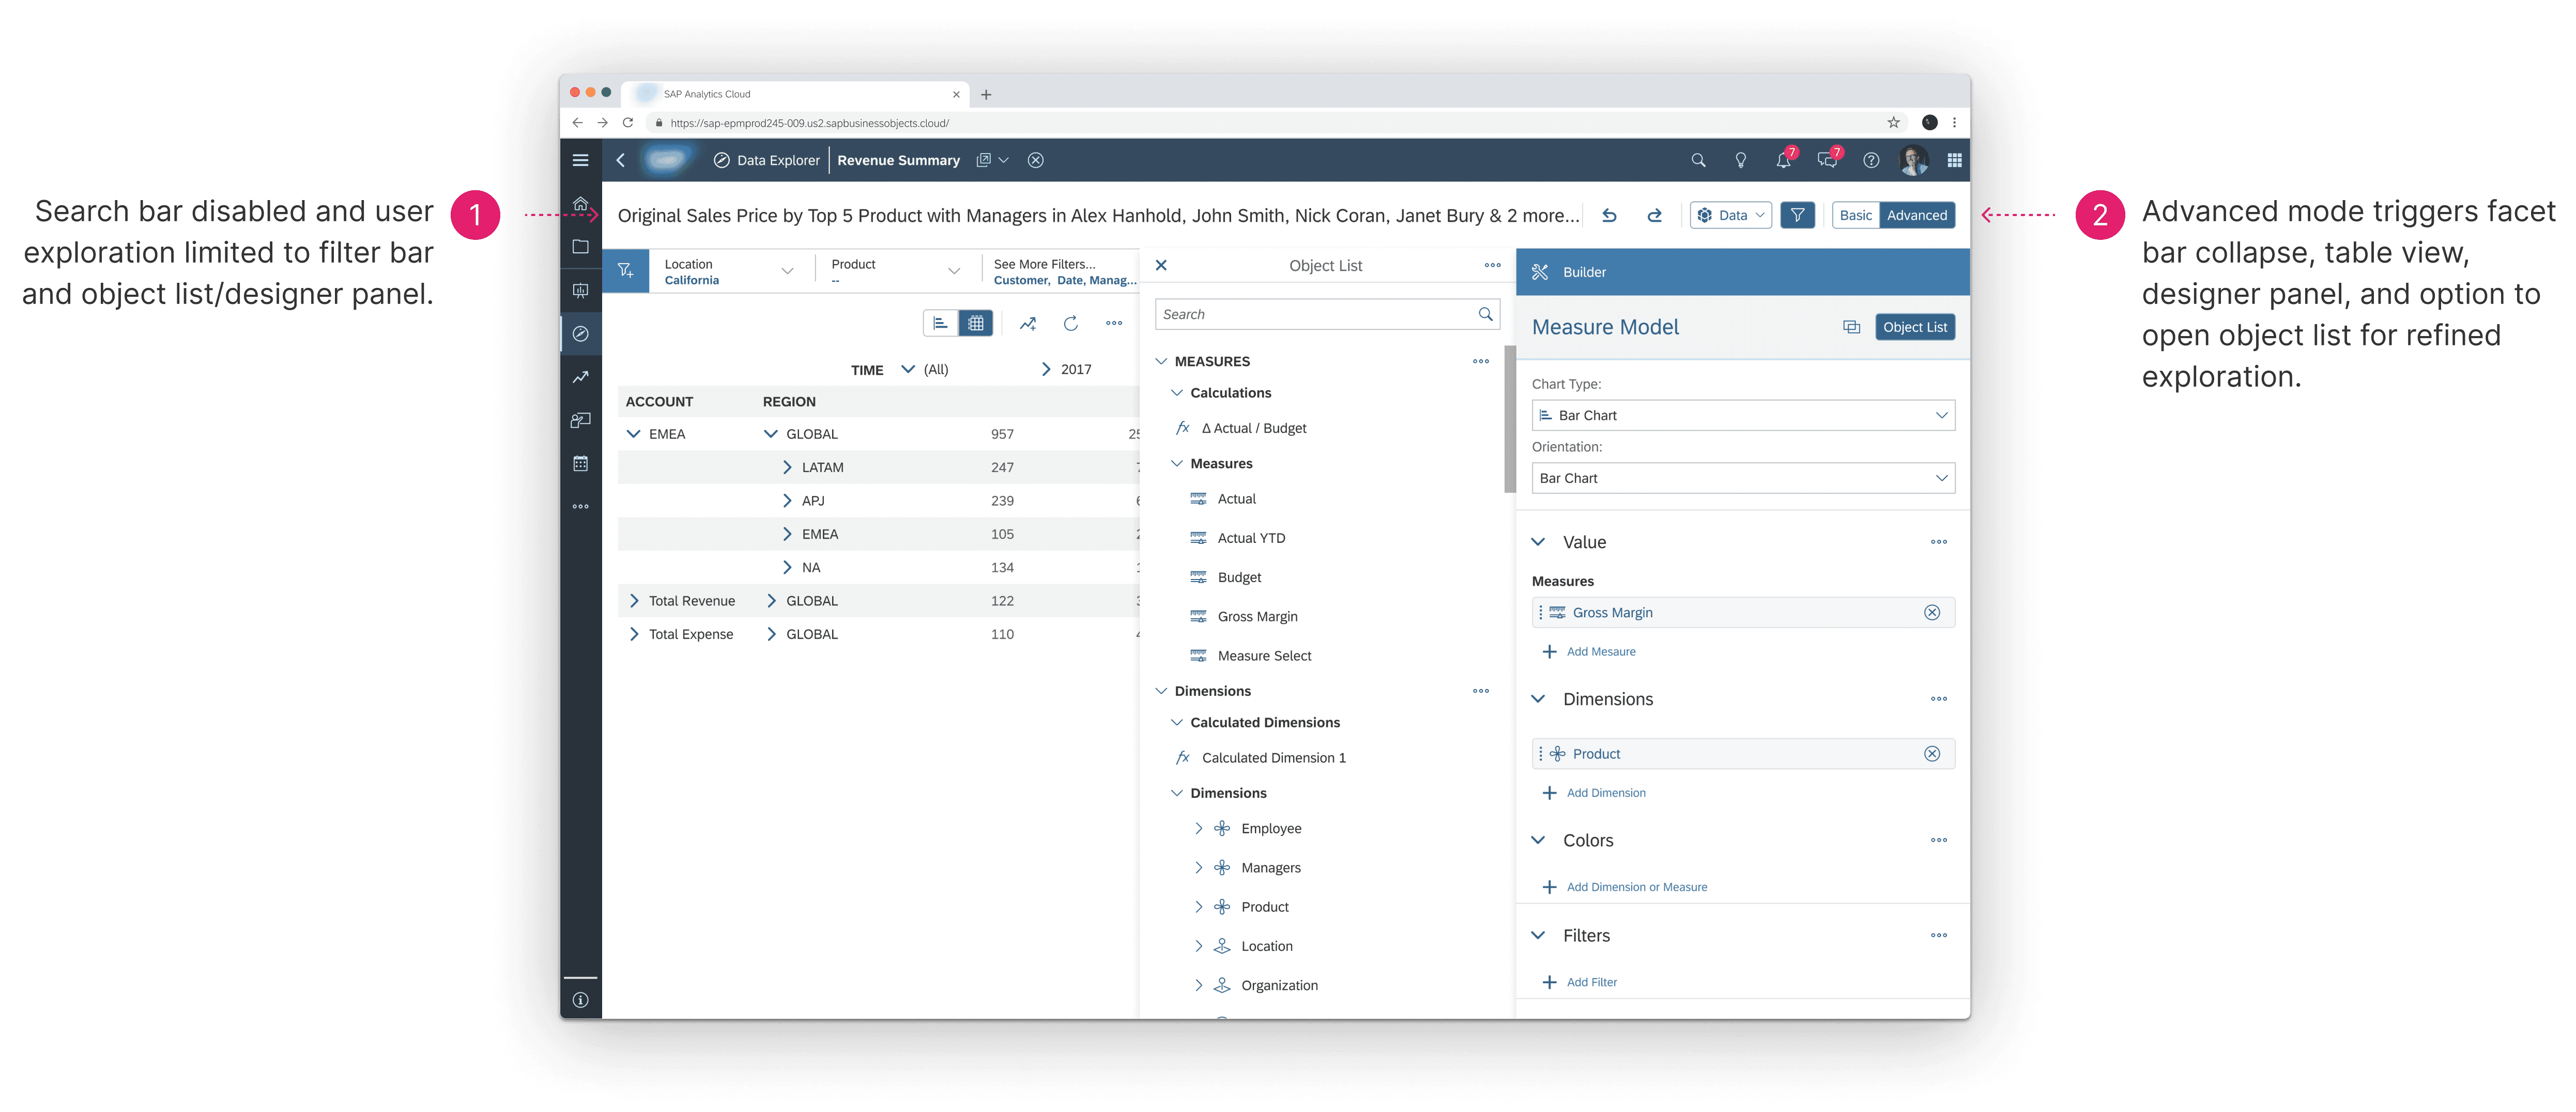
Interactive Search Query
Users have the ability to refine and explore their original query in the search bar or facet panel.
4
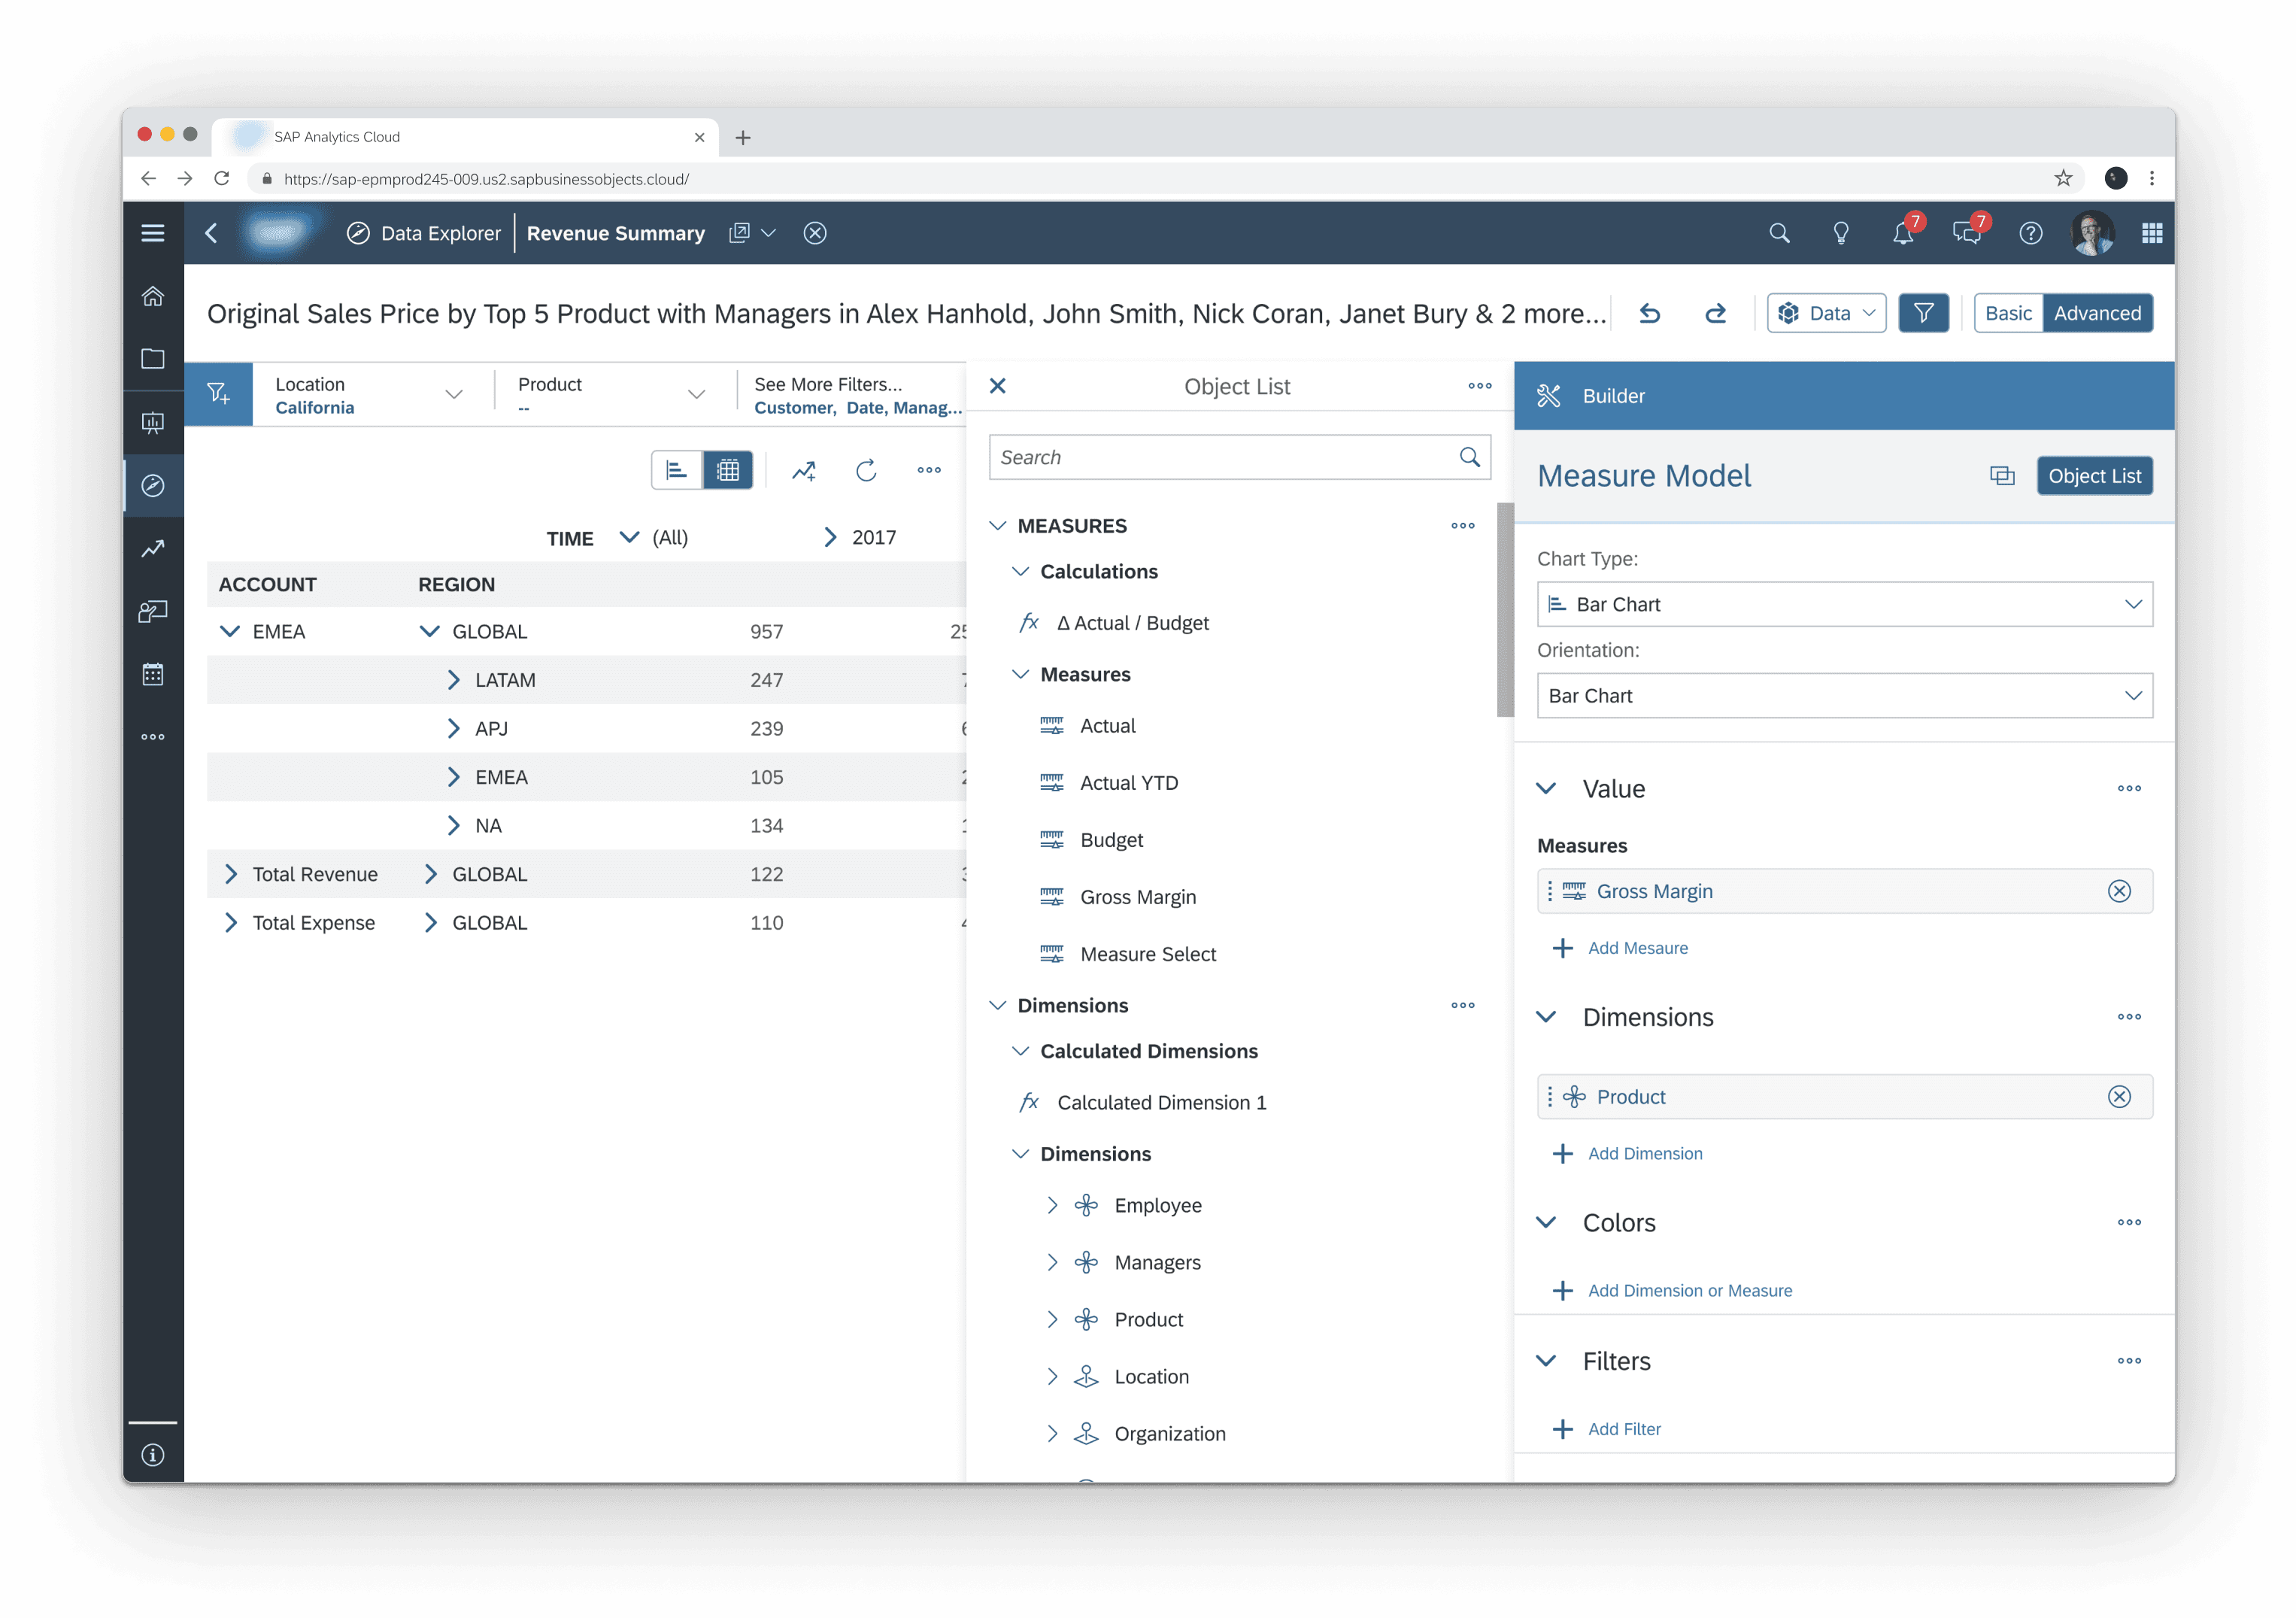
Advanced Mode
Transition to advanced mode for power user features and pivot table functionality.
The Design Process
Background
SAP Analytics Cloud is trying to become more cloud native and improve on its low NPS score due to poor usability. A key business goal was to create a more consistent experience across the platform.
The Problem
Currently, there are three different data exploration tools with three different target personas, interaction methods, and use cases.

Our Approach
A workshop and stakeholder interviews informing an iterative MVP development for senior management buy-in.
Stakeholder Interviews
30 minute semi-structured interviews were conducted to provide an overview of each tool, and establish design requirements for merging.
Product Management
Why
Knowledgable about customer feedback, industry trends, and overall product strategy.
Goal
To better understand customer feedback on each tool, how to align merge with future of data analytics, and roadmap prioritization.
Key Takeaways
• Analytics is moving towards more of an ad hoc service.
• Need to cater to non-technical users and progressively disclose to power users.
• Need to create tool to exist as ubiquitous and non file based.
Design
Why
Knowledgable about UI standards, customer personas, and known pain points.
Goal
Better understand UI guidelines to be enforced, known user pain points, and user personas.
Key Takeaways
• All tools have existing gaps in design standards which need to be closed.
Development
Why
Knowledgable about system architecture, technical constraints, and development costing.
Goal
Better understand which system base merging should start from, technical constraints of merge, investment costing for new feature development.
Key Takeaways
• Data analyzer has the fastest response time so could be used as the base to start the merge from.
Sales
Why
Knowledgable about customer pain points, what is in demand and future of analytics.
Goal
Better understand customer pain points, what customers need, and which features are in demand.
Key Takeaways
• 1000+ data explorer customers need an alternative to their needs with the end of flash and the current tool depending on it.
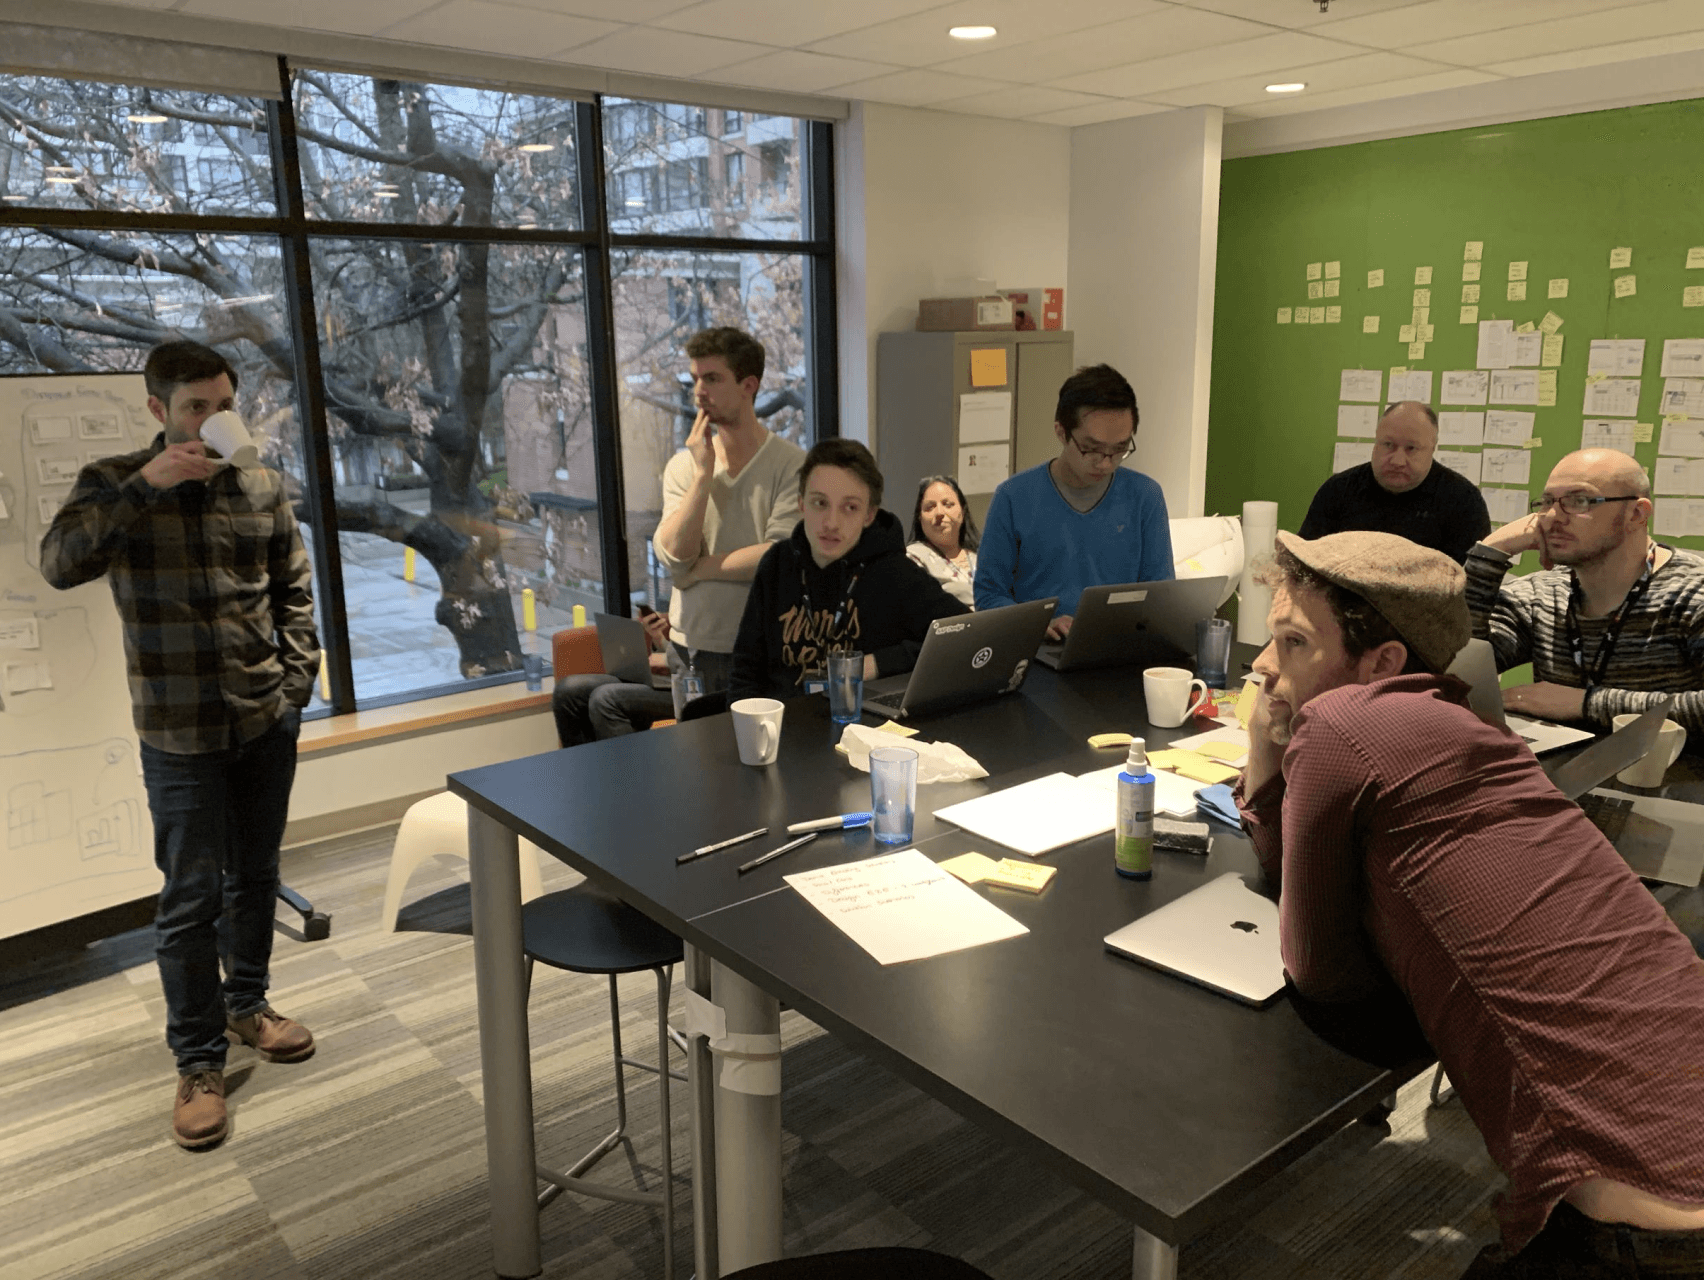
Workshop
A three day workshop bringing together senior members of product, development, and design for alignment, kick off, and collaborative ideation.

Key Insights
The data from stakeholder interviews and feedback from the workshop was synthesized and analyzed into 5 guiding insights.
Data Analyser as the base
Having the fastest performance, the other tools features should be progressively layered on top of Data Analyzer.
Created by LAFS
from the Noun Project
Design Standards
All design standards should be merged and brought up to the latest UI release.
Three Personas
Defined three key personas, the consumer, analyst, and power user. All should be served in progressive disclosure.
Merge Order
Data analyzer and data explorer should be merged first with the final addition of search to insight last.
No Files
The tool should not be file based and provide seamless ad hoc data exploration.
Concept Ideation
Slide in panels to integrating the facet panel, designer panel, and object list onto Data Analyzer.

Concept Ideation
Search bar point of entry to invite users of all levels of expertise.

Concept Ideation
Ability to scroll through past explorations and paths.

Mid-Fidelity
Stakeholder feedback was gathered and the leading designs were refined to mid-fidelity mockups with the following changes.


Design Solution
After another round of stakeholder feedback, the designs were refined into high fidelity mockups and pitched for investment.

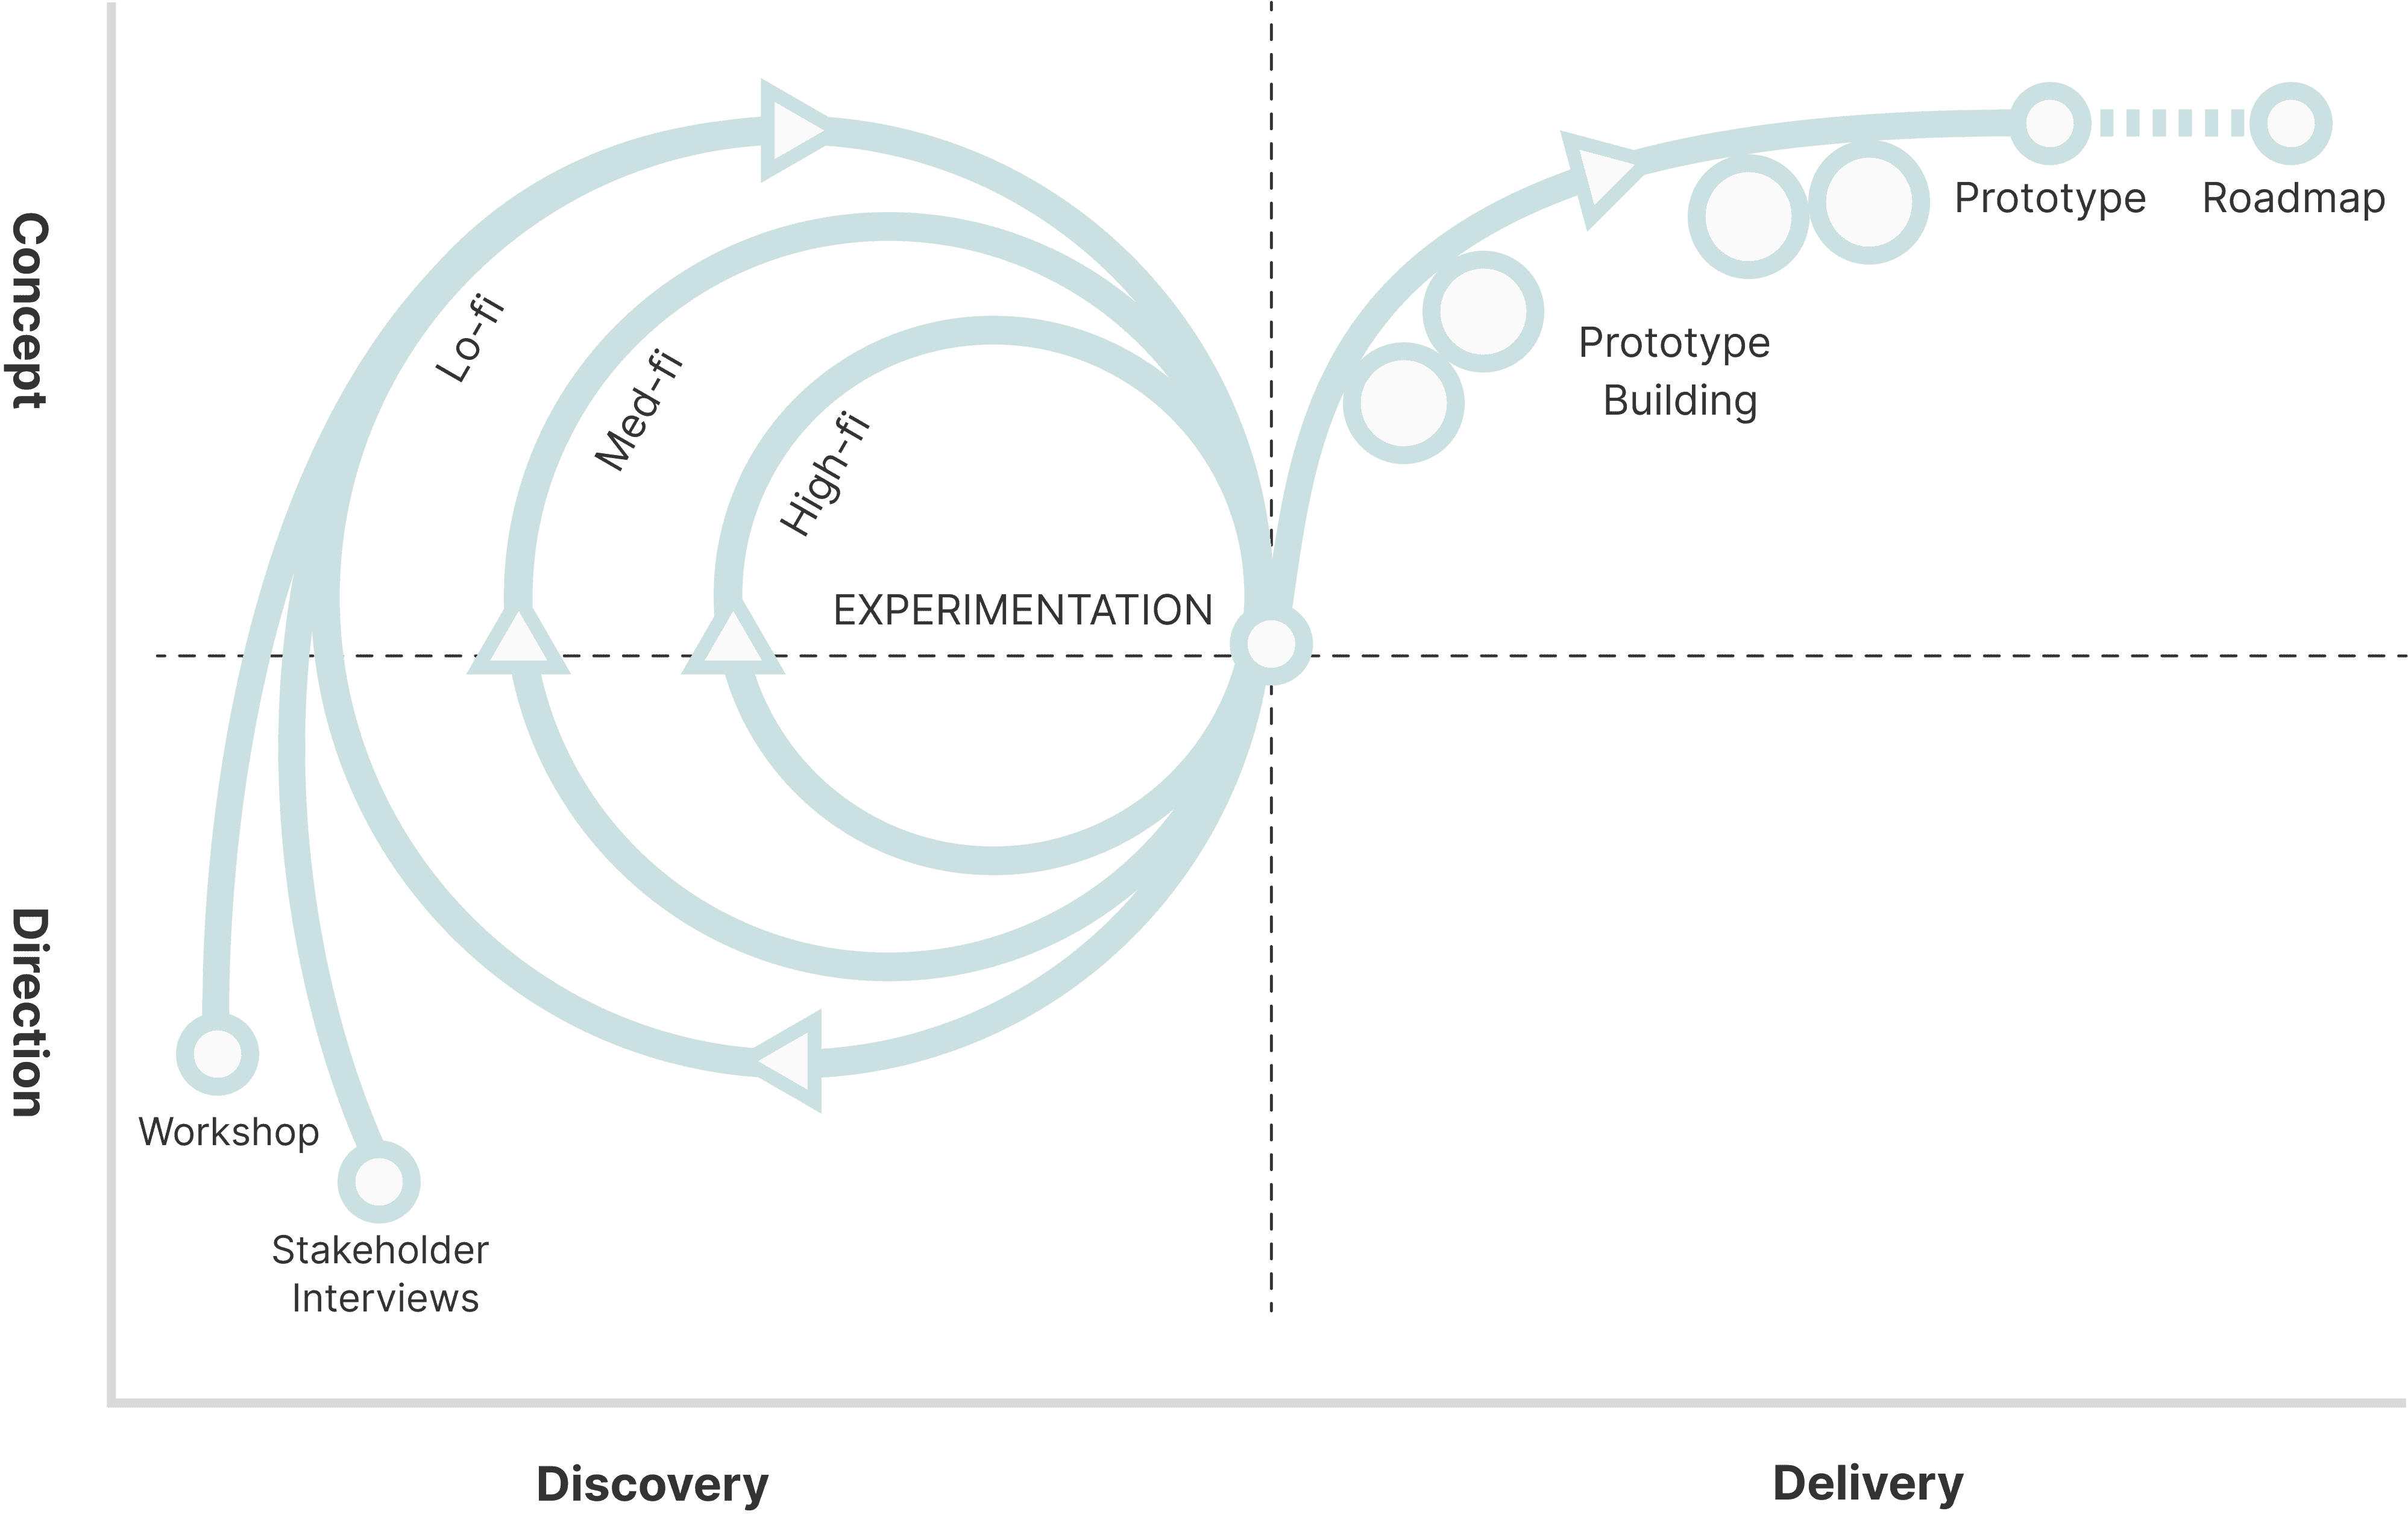
Prototype
A high fidelity prototype was created to communicate and pitch the design solution for investment from the senior director team.

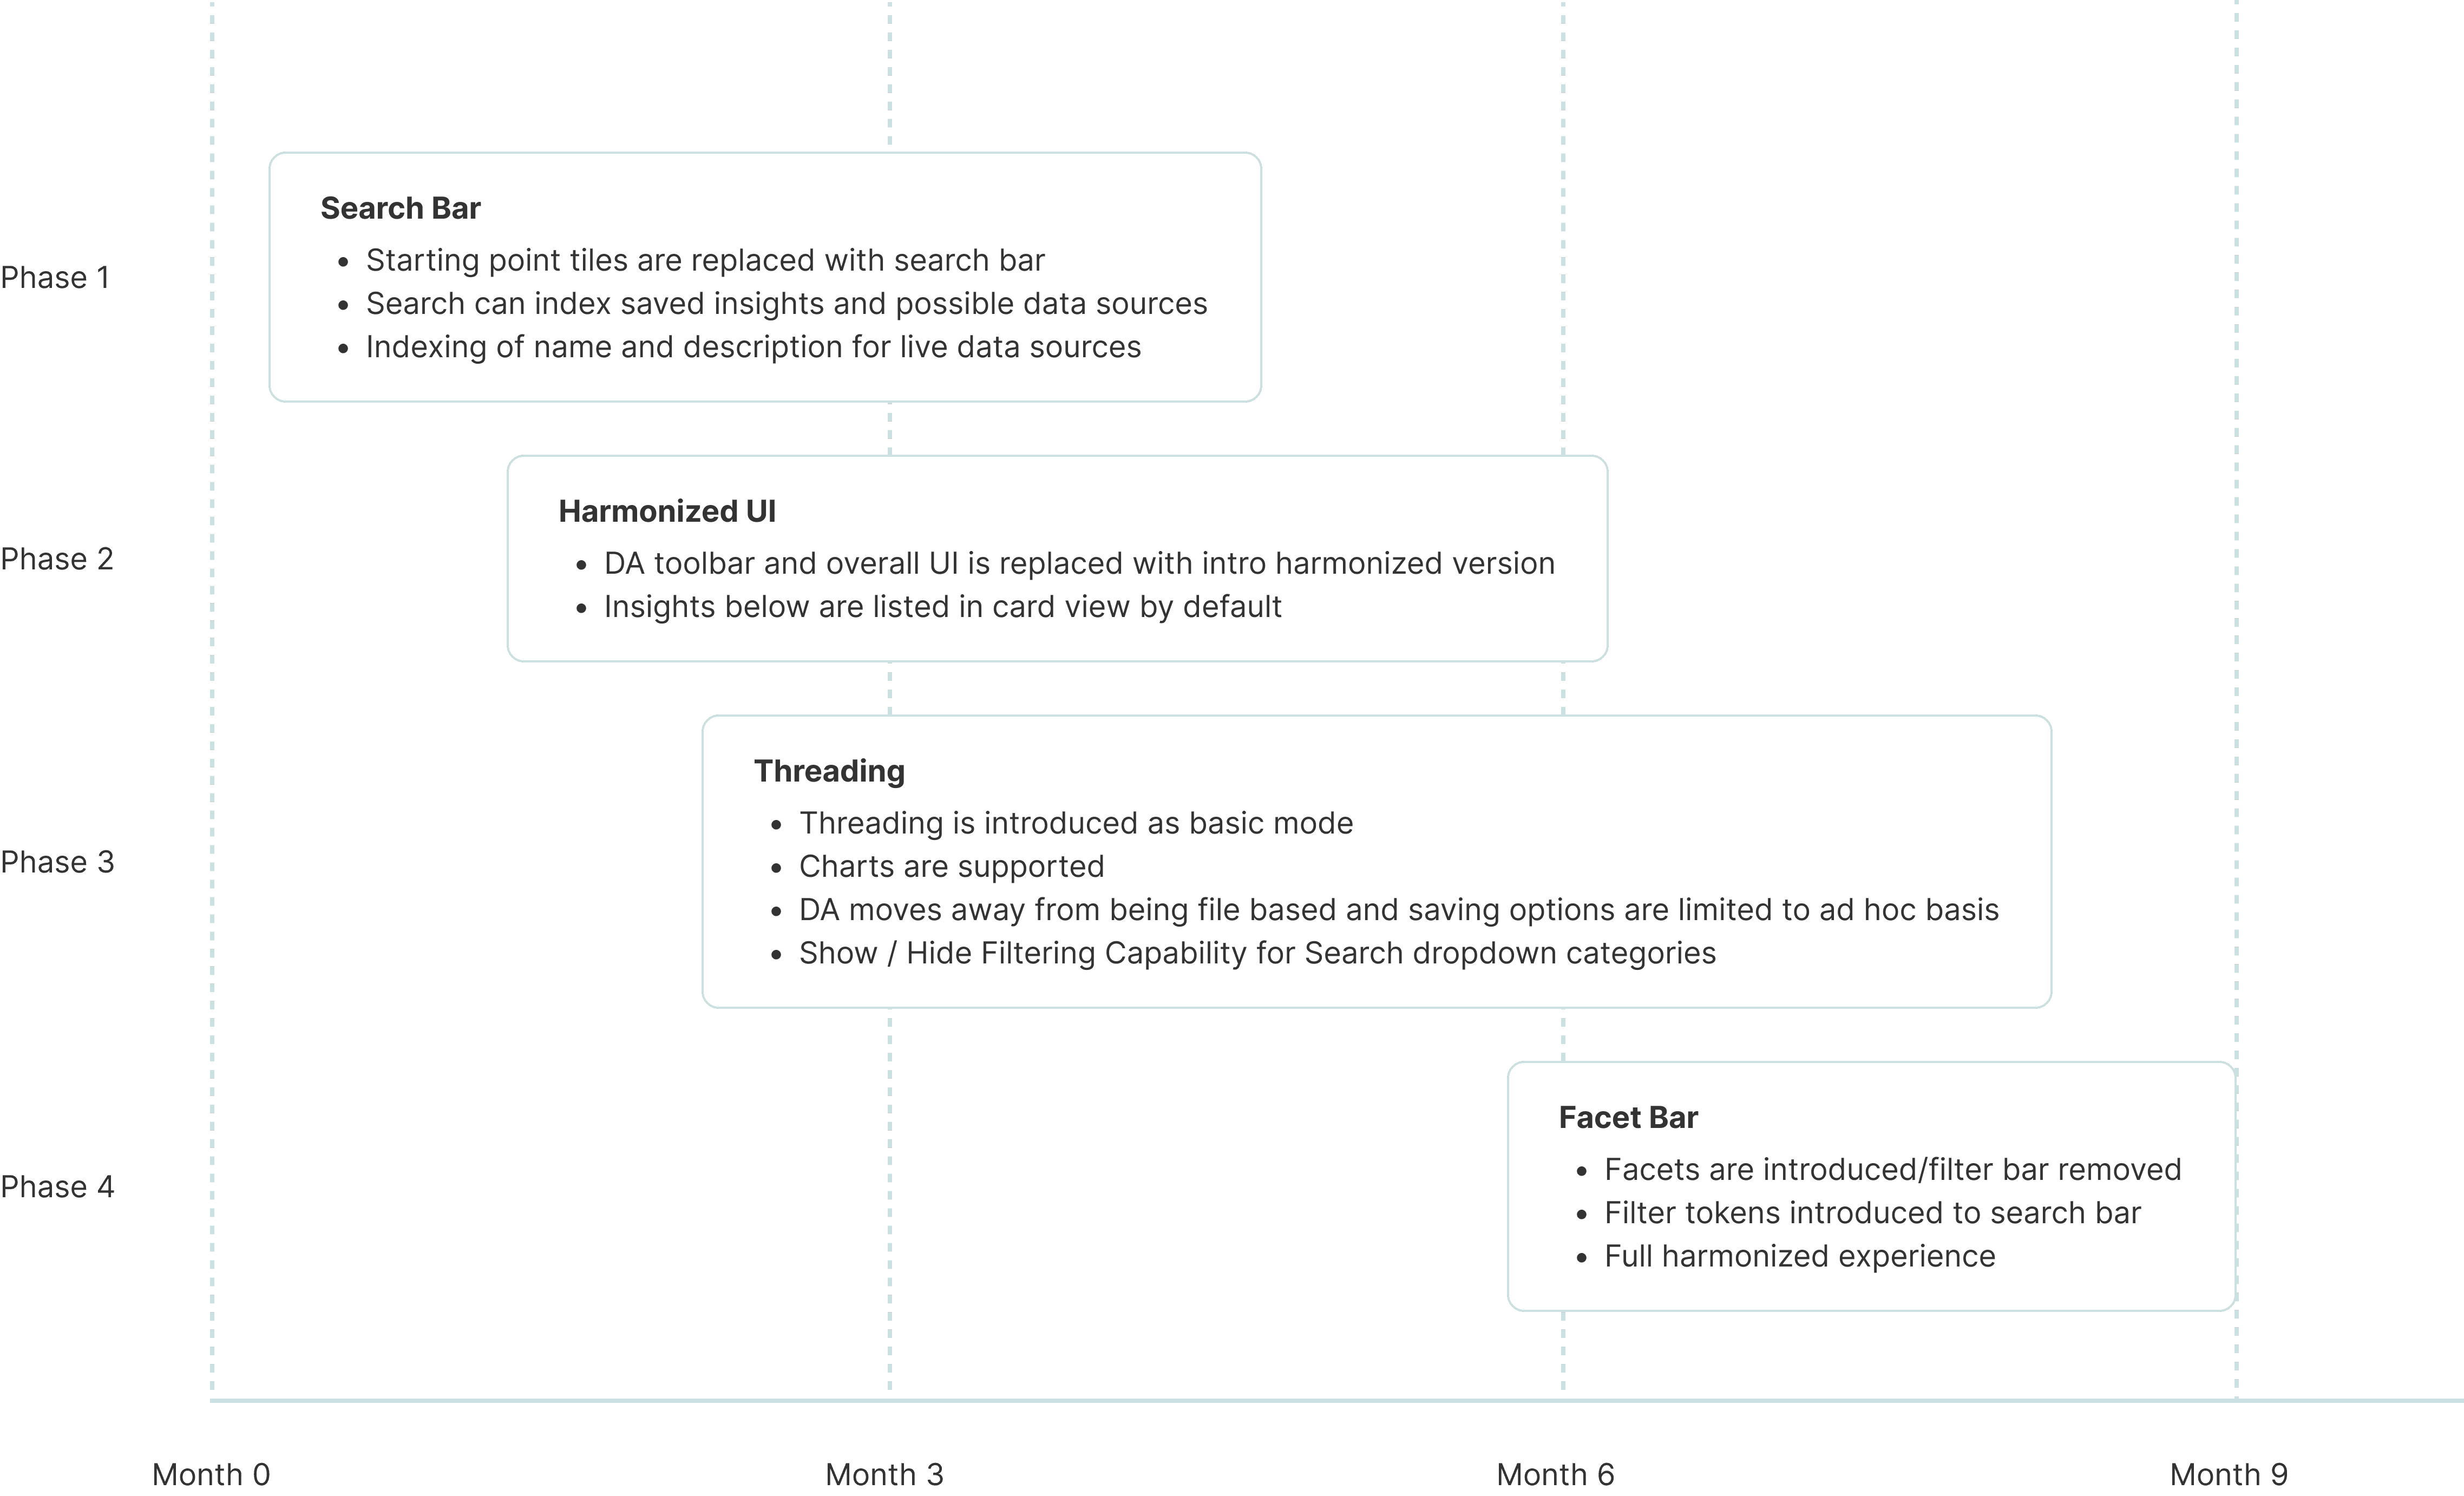
Roadmap
A high level roadmap was creating in collaboration with Product Management and Development.
Reflections
If you can’t communicate your designs then they will never see the light.
Proposal too large
Our concept proposal did not get built which was due to a change in resourcing priorities and the size of our proposal being too large. Earlier and more frequent collaboration with senior sponsors and development teams could have resulted in a more pragmatic solution that could have received investment.
Changing goalposts
Throughout the design process the goals of each individual exploration tool kept changing resulting in difficulty in remaining aligned with a harmonized future. A strategy that worked well was to have a firm north star product grounded in our user feedback. This acted as an anchor for the long term direction which helped individual teams align their more immediate decisions towards the eventual end goal.
Ownership Model
In the early stages of the design process there lacked a cohesive team and product manager dedicated to the project. In the future, as a designer, we could have taken the opportunity to fill these voids and bring together the necessary stakeholders earlier to get momentum moving faster.
Measuring Impact
Although the product was not launched during my time I would track net promoter score (NPS) and usage rate against our baseline data to gauge success. This is due to the fact that the exploration tool is one of many offerings in a larger product.

Website design and content by Ori Nevares